Strategy
Part of Getting Real Estate Marketing Strategy Right the First Time
Real Estate Marketing Strategy Benchmarks: Baselines, Ranges and Outliers
Real estate marketing strategy benchmarks need baselines, ranges and outlier rules drawn from your own funnel, not borrowed national averages.
What to take away
- Real estate marketing strategy benchmarks are three numbers, not one: a baseline you beat last period, a range you expect, and an outlier value that triggers an investigation.
- Response time is the service metric most worth a hard ceiling. Median hides the inquiries that sat for two days.
- NAR's 2025 profile puts agent use at 88 percent of buyers and 91 percent of sellers, which sets the audience, not your conversion rate.
- Segment on lawful service area, property type and channel. Never build a performance group from a protected trait or a proxy for one.
- Recalculate on a schedule and annotate every material change to inventory, rates, spend or staffing.
Real estate marketing strategy benchmarks only compare when the population, period, market, funnel stage and formula match. This guide was checked in August 2026 and sets no universal targets. Use the figures below as starting ranges, then replace them with your own trailing data.
Start from what the national survey actually says
NAR's 2025 Profile of Home Buyers and Sellers reports that 88 percent of surveyed primary-residence buyers used an agent or broker, and 91 percent of sellers did. That survey covers purchases from July 2024 through June 2025, weighted across 6,103 buyers, and excludes investors and vacation homes.
Read those two figures as audience context. They tell you most transactions run through an agent. They say nothing about how fast your leads answer, how many consultations you hold, or what a signed agreement costs you.
Service-quality baselines worth setting
Set a median and a ceiling for each of these, then watch the tail rather than the middle.
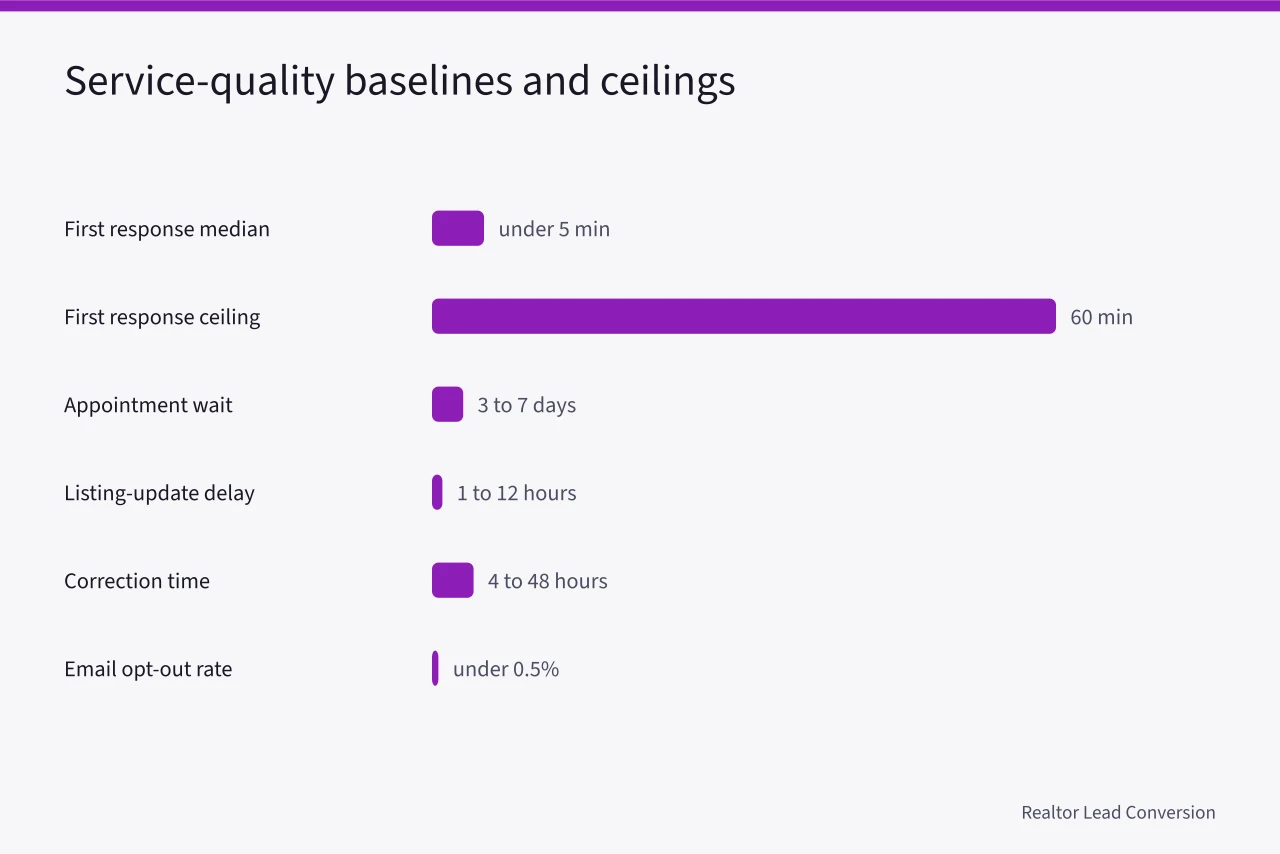
- First response time. Median target under 5 minutes during business hours, ceiling 60 minutes. A typical operating range across teams is 2 to 15 minutes. An inquiry unanswered past 24 hours is an outlier, not a slow day.
- Unanswered inquiries. Baseline 0. Any inquiry with no logged reply at close of business is a defect. Most teams that track this hold under 2 percent of inquiries unanswered.
- Appointment wait. Days from qualified contact to held consultation. Typical range 3 to 7 days. A relocation buyer with a two-week house-hunting window cannot wait ten days.
- Listing-update delay. Hours from price change or status change to live on every syndicated channel. Typical range 1 to 12 hours, ceiling 24 hours. Stale listings are the most common accuracy failure in IDX feeds.
- Correction time. Hours from a reported error in a listing, photo or testimonial to correction. Typical range 4 to 48 hours, shorter for factual errors than for media. Unverified testimonials and edited media both fail here.
- Opt-outs and complaint resolution. Count them monthly. A rising opt-out rate is a message problem, not a list problem. A typical email opt-out rate sits under 0.5 percent per send.
More leads are not an improvement when service capacity or accuracy falls. A funnel that adds 200 inquiries and drops first-response median from 4 to 90 minutes has gotten worse.
Cost and value baselines
Your allocation rule spreads spend across these cost categories:
- media
- portals
- technology
- content
- photography
- agency fees
- staff time
- events
- partner services
- compliance review
- overhead
Report cost per qualified inquiry, per held consultation, per signed agreement and per closed outcome. Keep refunds, cancellations, long cycles and attribution uncertainty in the numbers rather than smoothing them out.
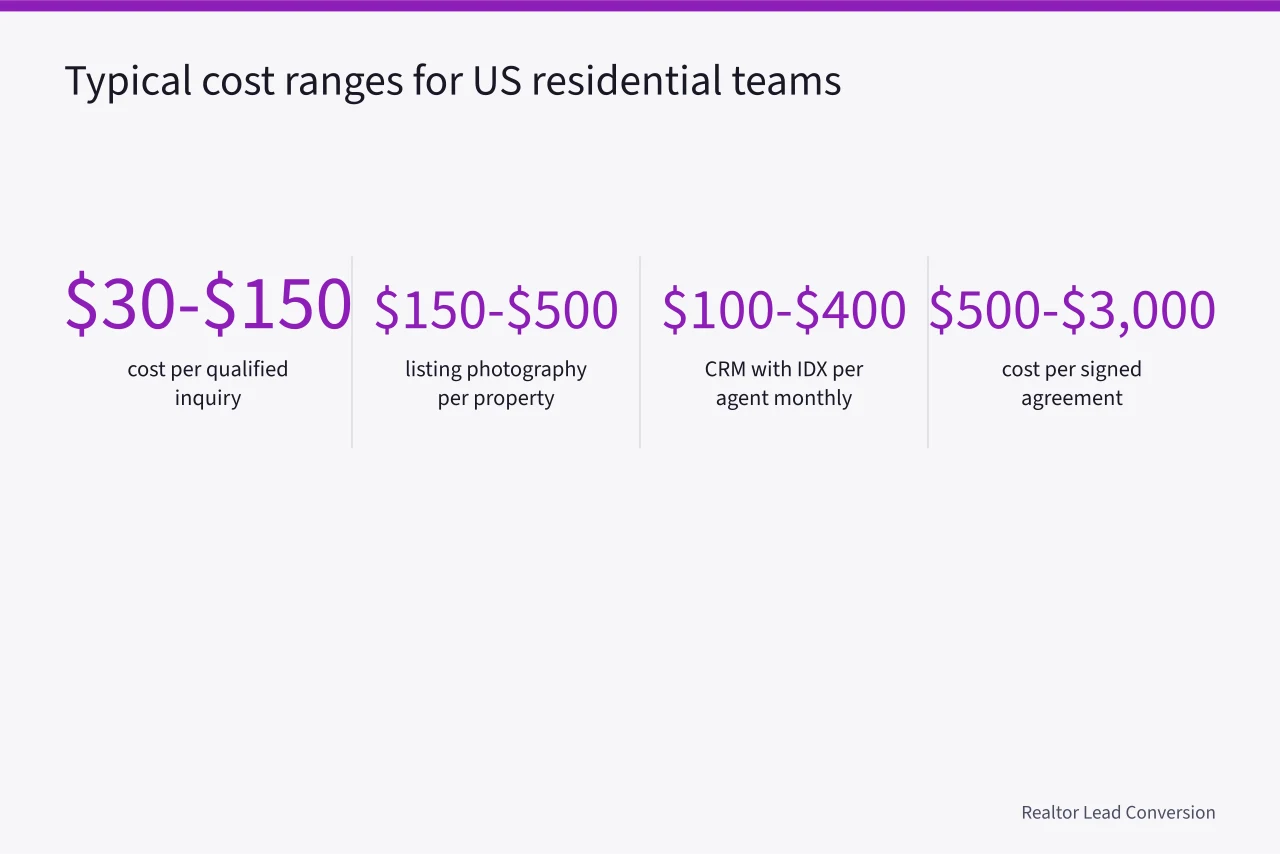
Figures below are typical ranges as of 2026 for US residential teams, not published averages. They cover channels such as Google Ads and Meta Ads for paid search and social. Zillow Premier Agent and Realtor.com run portal lead programs, alongside direct mail and open houses.
Paid search and paid social cost per qualified inquiry usually lands between $30 and $150. Portal and shared-lead programs often run higher per contact and lower per agreement because several agents chase the same buyer.
Listing photography typically runs $150 to $500 per property. A CRM with IDX feeds, including options such as Follow Up Boss and kvCORE, typically costs $100 to $400 per agent each month.
Cost per signed agreement typically falls between $500 and $3,000 in most markets. Cost per closed transaction, after commission splits, staff time and overhead, commonly reaches $2,000 to $8,000. Treat each figure as a range with a stated unit, not a target.
Where you lack a defensible figure, write the arithmetic in your own variables: cost per agreement equals allocated spend divided by signed agreements in the period. Substitute your figures rather than a number borrowed from another market.
Ranges and outlier rules
Use trailing medians and percentiles across comparable periods, not a single average. Annotate inventory, rates, season and spend changes beside each period. Annotate staffing, policy, form and market changes beside each period.
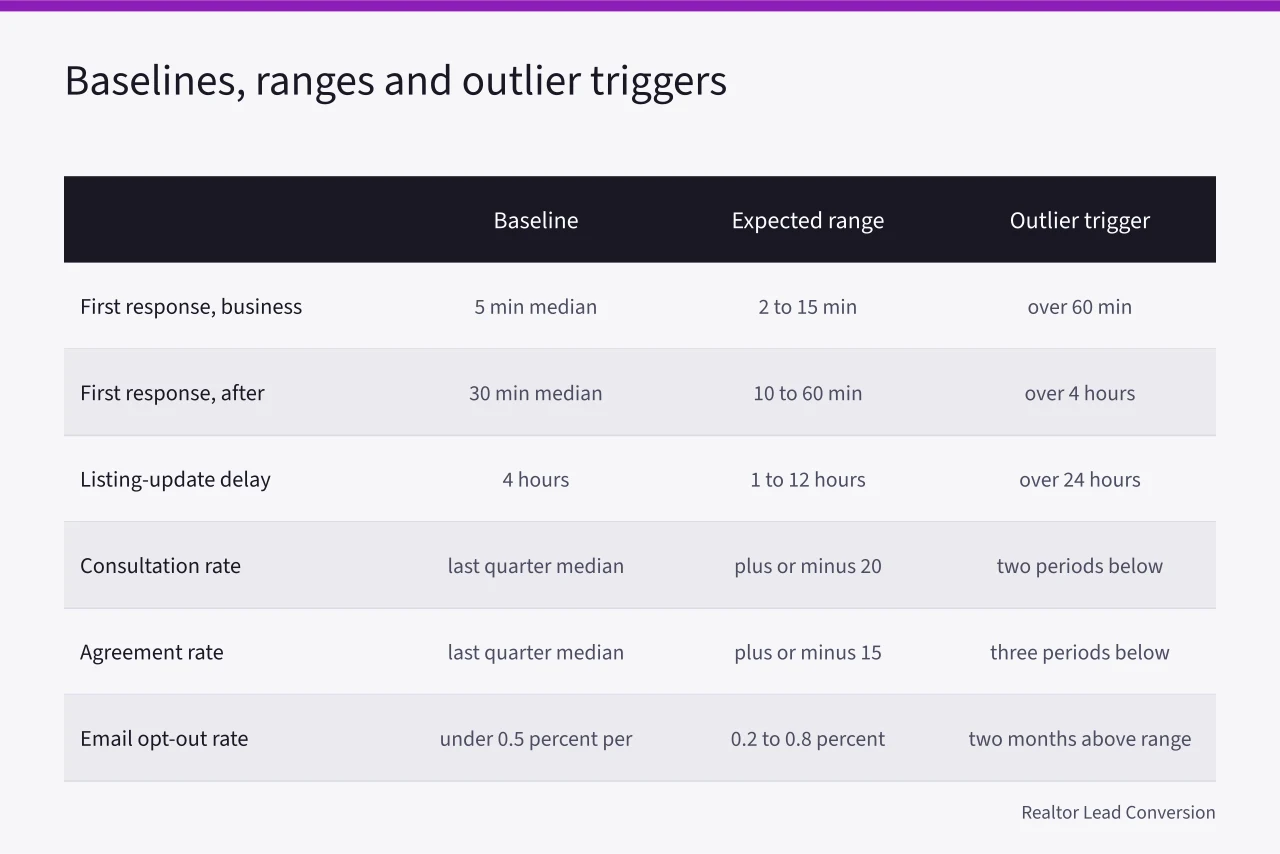
For every metric, publish four values: expected range, investigation boundary, capacity limit and stop rule. A stop rule is the point where you pause spend and fix the funnel instead of buying more leads.
| Metric | Baseline | Expected range | Outlier trigger |
|---|---|---|---|
| First response, business hours | 5 min median | 2 to 15 min | over 60 min |
| First response, after hours | 30 min median | 10 to 60 min | over 4 hours |
| Listing-update delay | 4 hours | 1 to 12 hours | over 24 hours |
| Consultation rate | last quarter median | plus or minus 20 percent | two periods below range |
| Agreement rate | last quarter median | plus or minus 15 percent | three periods below range |
| Cost per qualified inquiry | trailing 4-quarter median | $30 to $150 | above capacity limit |
| Cost per agreement | trailing 4-quarter median | plus or minus 25 percent | above capacity limit |
| Cost per closed outcome | trailing 4-quarter median | $2,000 to $8,000 | above capacity limit |
| Email opt-out rate | under 0.5 percent per send | 0.2 to 0.8 percent | two months above range |
Segment without unsafe inference
Compare lawful service area, property type, client situation, channel and campaign when sample size and privacy allow. Compare creative, device and time of day.
Do not build performance groups from protected traits or proxies for them just because an ad platform offers the targeting. Audience selection and delivery need fair-housing review, and that review shapes the lawful audience records kept in real estate email marketing.
Make the comparison reproducible
The GAO evaluation design guide ties evaluation questions to evidence needs and design choices. Apply that discipline here: internal reporting is not a controlled effect estimate.
The NIST experimental design selection guidance starts design choice with the objective and the practical constraints. That is the right order for a benchmark review too.
For external housing context, the Census Bureau's Housing Vacancy Survey methodology describes a probability sample of about 72,000 occupied and vacant units on a 4-8-4 rotation, covering all states and the District of Columbia.
Check geography, method, period and revision before quoting any estimate, and treat sampling error as part of the number.
Common questions
What is a good real estate conversion rate?
There is no universal rate.
A useful range needs the same factors on both sides of the comparison:
- market
- client situation
- property type
- stage definition
- time window
- source
- service level
- exclusions
Typical funnel ranges in most US markets: inquiry to held consultation 10 to 30 percent, consultation to signed agreement 20 to 40 percent, and lead to closed transaction 1 to 5 percent. Each carries a unit and a stage definition.
Can national housing data benchmark my campaign?
It gives dated market context. It cannot replace local funnel records built on consistent definitions and the quality checks that catch stale listings and misattributed sources.
How often should benchmarks change?
Recalculate on a scheduled cadence after data checks:
- annotate material changes in market conditions
- inventory
- rates
- spend
- staffing
- forms
- policies or attribution
Answer the common real estate marketing strategy questions about audiences and channels in the same review.